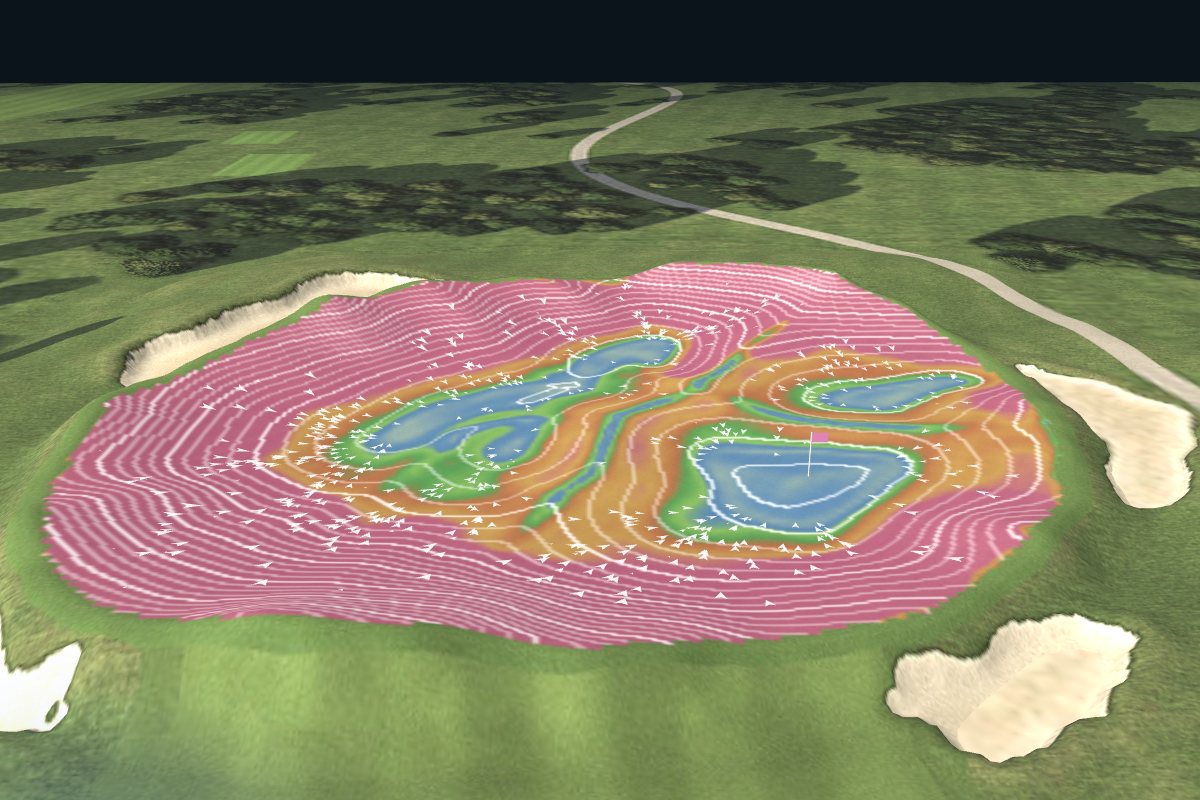
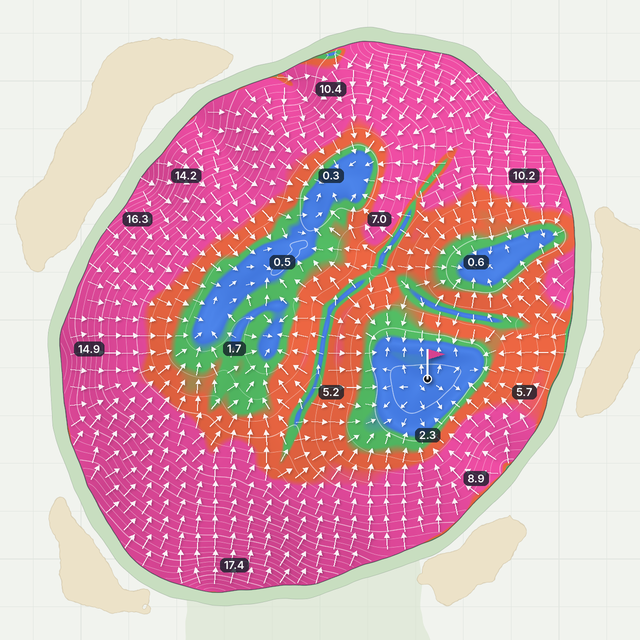
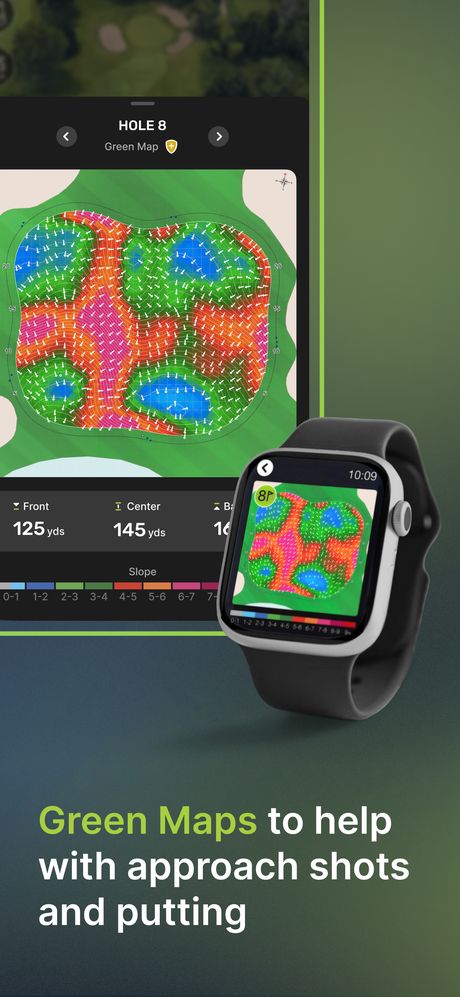
A green map shows how a green tilts. Colors show how steep each spot is, arrows point downhill (the way putts break) and numbers give the slope in percent.
The view from the fairway. This green is 58 yards deep, so the pin can change your approach by a club or more.
Front352yds
Center381yds
Back409yds
The colors and arrows come from its green map. The next steps explain each one.
Step 2 · The photo
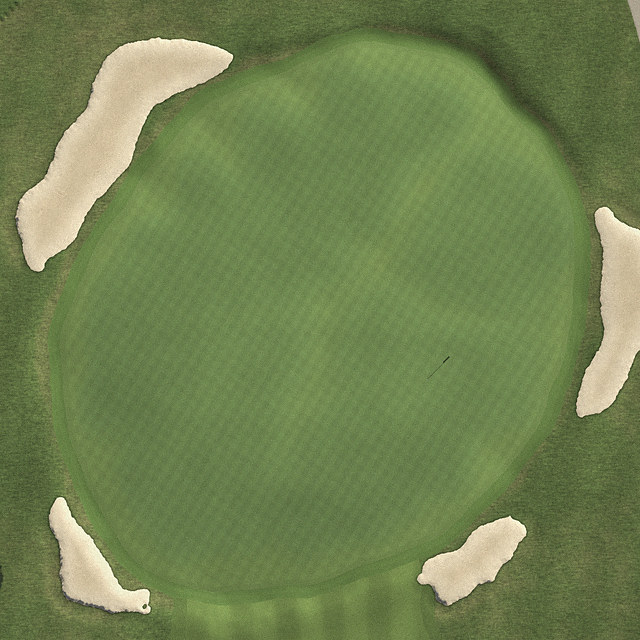
From above, a green looks flat
An aerial photo shows the edge and the bunkers, but almost nothing about slope. Darker patches are the only hint: low spots hold water.
Green mapPhoto
Slide to switch between the photo and the green map.
Step 3 · Colors
Color tells you how steep
Each color is a slope range, in percent. A 1% slope drops 1 foot over 100 feet.
0–2%Flat. A ball stops here.
2–4%Gentle. Common hole locations, depending on green speed.
4–6%Real tilt. Putts break hard.
6%+Steep. Hard to stop a ball.
Pink covers everything from 6% up. On this green the pink banks reach 12–18%.
Step 4 · Arrows
Arrows point downhill
Each arrow shows which way the ground falls, which is the way your putt will break.
Here the edge arrows all point in: the edges are high and everything drains to the middle. That's a punchbowl.
Step 5 · Numbers
Numbers give the mapped slope
Each number is the slope in percent at that spot. 0.5 in the left-center bowl is almost flat; 17.4 on the front bank is a wall.
Colors are ranges; the numbers tell you how much break to play.
Step 6 · The pockets
Find the flat pockets
Blue and green areas are flat pockets, where pins are cut and balls settle. This green has three: a left-center bowl, a back-right pocket and a front-right bowl.
Today’s pin is in the front-right bowl.
Step 7 · Your approach
Let the slope do the work
Land your ball on the bank above the pin's pocket and let the slope feed it to the hole.
If you end up on a pink bank, putt to the flat pocket first. Don't charge the hole.
Step 8 · Try it
Drop a ball anywhere
Tap the green and watch where the slope takes the ball. Try a pink bank, then a flat pocket.
The ball rolls at tournament speed (about 12 on the Stimpmeter). Hover or tap to read the slope anywhere.
In the app, Green Maps are flat slope-and-break maps like Step 2. This 3D model is a teaching tool built from a real green map, changed for this page. Green map data: StrackaLine. The aerial view is computer-generated.
Slope decoder
Green slope chart: what each percent means
Slope is the drop in height over distance: 1% drops about 1.2 inches over a 10-foot putt. Drag the slider to see the difference.
2.0%
0%2%4%6%8%
Drop over 10 ft2.4 in
Drop over 20 ft4.8 in
On this mapGentle
What it meansCommon hole locations, depending on green speed.
Slope
Drop over 10 ft
Color on this map
What it means
0–1%
Up to 1.2 in
Gray-blue
Nearly flat. Long putts on fast greens can still move.
2%
2.4 in
Blue to green
Gentle. Common around hole locations.
3%
3.6 in
Green
Noticeable break, especially on longer putts.
4%
4.8 in
Red
Real tilt. Putts break hard.
5%
6.0 in
Orange
Hard to stop a ball close to the hole.
6%+
7.2 in or more
Pink
Steep. Hard to stop a ball, especially on fast greens.
Drop = slope × distance (1% of 120 inches is 1.2 inches). The drawing's tilt is exaggerated. Color scales vary: in TheGrint Green Maps, gray is nearly flat (about 0 to 1%) and stronger colors are steeper.
On the course
How to read greens on the course
Use these steps to confirm the map on the green.
Start reading on your approachThe overall tilt is easiest to see from 30 to 50 yards out. Note the high side and where water would drain.
Find the high side and the low sideDecide which way the putt breaks. On a green map, follow the arrows near the hole.
Find the fall lineThe straight-downhill line through the hole. Putts along it break little, but contours can change on the way.
Look from the low sideRead from behind your ball, then from the low side halfway to the hole. The low side shows slope best.
Feel it with your feetStraddle your line. Your feet often feel slopes your eyes miss.
Pick your speed, then your lineA firmer putt breaks less and a softer putt breaks more. Downhill putts and fast greens break the most.
Check the grain on Bermuda and paspalum greensGrain can add break and change speed. Putts down-grain roll faster. Shiny, light grass usually means the grain runs away from you.
Green speed
Green speed and the Stimpmeter
A Stimpmeter is a 36-inch ramp held at about 20°. A ball released from a notch 30 inches up rolls onto a flat part of the green. The average roll in feet, from two opposite directions, is the green's speed.
The reading is how many feet the ball rolls on a flat part of the green.
68101214
8–10Most everyday courses
About 12Typical tour events
13–14Major championships
Faster greens make the same slope break more: a 2% slope that's easy at 9 can be tricky at 12. Edward Stimpson invented the Stimpmeter in 1935; the United States Golf Association® (USGA®) refined it and released it to superintendents in 1978.
Green shapes
Common green shapes and how they play
Punchbowl
Edges high, middle low. Balls feed to the center, like the green in the 3D model.
Crowned
High in the middle and falling off every edge. Shots that miss the top roll away.
Tiered
Two levels joined by a slope. Landing on the wrong tier leaves a hard two-putt.
False front
The front slopes back toward the fairway. Approaches that come up short roll off the green.
Back to front
The most common tilt. Leave the ball below the hole for an uphill putt.
In TheGrint
Green Maps in TheGrint
Green Maps in TheGrint show the slope and break of a green in color: gray for nearly flat (about 0 to 1%), stronger colors for steeper slopes, and arrows for break direction. They cover 25,000+ courses.
Before you hit: check the Green Map in the GPS tools to pick the side that leaves an easier putt.
On the green: check it again before you read your line.
On your watch: with Pro, Green Maps work on Apple Watch Series 4 or newer and on Wear OS watches.
Auto-Open: Pro members can have the Green Map open automatically.
Green Maps
Free
Pro
On the phone
3 lifetime trial views
Unlimited
On your watch
–
✓
Auto-Open Green Map
–
✓
To open one, start a GPS round on a course with Green Maps and tap Green Maps in the GPS tools. Try TheGrint Pro free for 7 days.
Colors show how steep each spot is, arrows show which way the ground falls and numbers give the slope in percent. Find the flat pockets where pins are cut, then follow the arrows to see the break.
What do the colors on a green map mean?
Each color is a slope range. Here, blue is flat (0 to 2%), green is gentle (2 to 4%), red and orange are 4 to 6% and pink is 6% or more. Scales vary: in TheGrint Green Maps, gray is nearly flat (about 0 to 1%) and stronger colors are steeper.
What does slope percentage mean on a putting green?
Slope percentage is how much the ground drops over a distance. A 1% slope drops 1 foot over 100 feet, which is about 1.2 inches over a 10-foot putt. A 4% slope drops about 4.8 inches over the same putt.
Which way do the arrows on a green map point?
Downhill. The arrows show the way water runs off the green and the way your putt will break.
What slope is considered flat on a golf green?
Under about 2%, where a ball will stop. Holes are usually cut in gentle 2 to 4% areas, flatter on fast greens. At 6% and up, a ball rarely stops.
What is a Stimpmeter?
A Stimpmeter is a 36-inch ramp that measures green speed. A ball released 30 inches up the ramp rolls onto the green; the average distance it rolls, in feet, is the speed.
What is a good green speed?
Most everyday courses run about 8 to 10 on the Stimpmeter. Tour events are typically about 12, and major championships can reach 13 to 14. Faster greens make the same slope break more.
Are TheGrint Green Maps free?
Green Maps are a Pro feature. Free members get 3 lifetime trial views, and Pro comes with a 7-day free trial.
How many courses have Green Maps in TheGrint?
Green Maps cover 25,000+ courses in TheGrint.
Are TheGrint Green Maps 3D?
No. Green Maps in TheGrint are slope and break maps, not 3D models of the green. The 3D model on this page is a teaching tool built from a green map.
Sources
How we built this page
The 3D model and Steps 1 to 8 use a real green map, changed for this page. Slope math is standard geometry (percent slope = rise ÷ run × 100). Green speed facts come from the sources below. Green Maps details come from TheGrint. Last checked November 5, 2026.